[Solved] MATH225N Week 4 Assignment: Contingency Tables
Question Researchers wanted to study if couples having children are married. They surveyed a large group of people. The data are shown in the contingency table below. What is the […]
[Solved] MATH225N Week 4: Midterm Exam Week 1 – 4
Q1 In a study about political preferences, a researcher randomly selected an equal number of men and women to survey. Is the study observational or experimental? If it […]
[Solved] MATH225N Week 4 Assignment: Probability Terminology and Notation
Question 1 Arianna will roll a standard die 10 times in which she will record the value of each roll. What is a trial of this experiment? Ans: one roll of the […]
[Solved] MATH225N Week 4 Assignment: Mutually Exclusive Events
Question 1 Identify the option below that represents mutually exclusive events. Ans: drawing a red card and then drawing a black card with replacement from a standard deck of cards […]
[Solved] MATH225N Week 4 Assignment: Distribution with Probability Rules – Excel
Question 1 At a certain fast food restaurant, 77.5% of the customers order items from the value menu. If 14 customers are randomly selected, what is the probability that at least 9 customers ordered an item […]
[Solved] MATH225N Week 3 Assignment: Measures of Central Tendency
Find the mode of the following list of points earned on a 16-point quiz given during a finance class. 7,7,3,2,7,16,12,16,12 Find the median of the following set of data. 36,22,24,30,44,13,21,34,18 Find the […]
[Answered] MATH225N Week 3 Assignment: Measures of Central Tendencies
Question 1 An art collector bought 20 paintings at an art fair, and wants to know the average price of the paintings she purchased at the fair. She adds the prices of […]
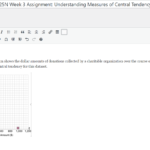
[Solved] MATH225N Week 3 Assignment: Understanding Measures of Central Tendency
Question 1 The following histogram shows the dollar amounts of donations collected by a charitable organization over the course of a month. Identify the best measure of central tendency for […]
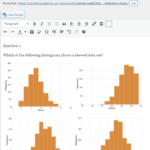
[Solved] MATH225N Week 3 Assignment: Distribution Shape
Question 1 Which of the following histograms shows a skewed data set? Question 2 Given the following box-and-whisker plot, decide if the data is skewed or symmetrical. Ans: The data […]