Solutions
Question 1
Data is collected on the relationship between time spent playing video games and time spent with family. The data is shown in the table and the line of best fit for the data is y^=−0.27x+57.5. Assume the line of best fit is significant and there is a strong linear relationship between the variables.
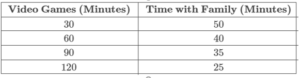
According to the line of best fit, the predicted number of minutes spent with family for someone who spent 95 minutes playing video games is 31.85. Is it reasonable to use this line of best fit to make the above prediction?
Ans:
The estimate, a predicted time of 31.85 minutes, is unreliable but reasonable.
The estimate, a predicted time of 31.85 minutes, is both unreliable and unreasonable.
The estimate, a predicted time of 31.85 minutes, is both reliable and reasonable.
The estimate, a predicted time of 31.85 minutes, is reliable but unreasonable.
Question 2
Which of the following are feasible equations of a least squares regression line for the annual population change of a small country from the year 2000 to the year 2015? Select all that apply.
Ans:
yˆ=38,000+2500x
yˆ=38,000−3500x
yˆ=−38,000+2500x
yˆ=38,000−1500x
Question 3
To test the effectiveness of a drug proposed to relieve symptoms of headache, physicians included participants for a study. They gave the drug to one group and a drug with no therapeutic effect to another group. Which group receives the placebo?
Ans:
the physicians
the group that received the drug for headache
the group that received the drug with no therapeutic effect
all of the people in the study
Question 4
Becky’s statistics teacher was teaching the class how to perform the z-test for a proportion. Becky was bored because she had already mastered the test, so she decided to see if the coin she had in her pocket would come up heads or tails in a truly random fashion when flipped. She discretely flipped the coin 30 times and got heads 18 times.
Becky conducts a one-proportion hypothesis test at the 5% significance level, to test whether the true proportion of heads is different from 50%.
Which answer choice shows the correct null and alternative hypotheses for this test?
Ans:
H0:p=0.6; Ha:p>0.6, which is a right-tailed test.
H0:p=0.5; Ha:p<0.5, which is a left-tailed test.
H0:p=0.6; Ha:p≠0.6, which is a two-tailed test.
H0:p=0.5; Ha:p≠0.5, which is a two-tailed test.
Question 5
A farmer divided his piece of land into 4 equivalent groups. The quality of the soil is the same across the 4 groups of land. He planted the same crop in all 4 groups of land and recorded the yield of the crop in all 4 groups for a 4 week period. Is the study observational or experimental? If it is an experiment, what is the controlled factor?
Ans:
The study is an observational study.
Question 23
A recent study suggested that 81% of senior citizens take at least one prescription medication. Amelia is a nurse at a large hospital who would like to know whether the percentage is the same for senior citizen patients who go to her hospital. She randomly selects 59 senior citizens patients who were treated at the hospital and finds that 49 of them take at least one prescription medication. What are the null and alternative hypotheses for this hypothesis test?
Ans:
{H0:p=0.81Ha:p>0.81
{H0:p≠0.81Ha:p=0.81
{H0:p=0.81Ha:p<0.81
{H0:p=0.81Ha:p≠0.81
Question 24
A statistics professor recently graded final exams for students in her introductory statistics course. In a review of her grading, she found the mean score out of 100 points was a x¯=77, with a margin of error of 10.
Construct a confidence interval for the mean score (out of 100 points) on the final exam.
Ans:
(67,87)……………………please follow the link below to purchase all the answers at $15