
COURSE:
ECON312N: Principles of Economics
Introduction
This assignment is based on the exploration and analysis of unemployment. These variables are compiled by the Bureau of Economic Analysis and are used extensively by the Federal Reserve of St Louis, in a database called FRED (Federal Reserve Economic Data), which is made up of nearly 140,000 economic time series from more than 50 data producers.
Activity Instructions
For this assignment, review and analyze the graphs developed using the FRED graphing tool. Note that the shaded areas on the graph show periods during which there were recessions.
Present your information in a narrated PowerPoint presentation. Copy and paste the graphs into your presentation. Include the following:
- A slide for each series graph (A-D) with an assessment of the labor market during the period of the Great Recession (2007 to 2009). Compare to the time before and after the great recession.
- Provide a comparative analysis of the performances of the variables versus FRED’s UNRATE variable.
- Pick one (1) of the series of graphs and analyze the economic factors that account for the differences in unemployment rates.
Measuring Unemployment
Items A-D below will require the analysis of Multi-Series Graphs.
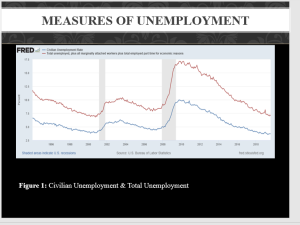
A. Measures of Unemployment
- The Civilian Unemployment Rate (FRED code: UNRATE) from 1997 (January) to 2019 (January). (Note: this is the official Unemployment Rate)
- A Multi-Series Graph and plot Special Unemployment Rate (FRED Code – U6RATE) from 1997 (January) to 2019 (January). (Note: this is Total Unemployed, Plus All Marginally Attached Workers, Plus Total Employed Part-Time for Economic Reasons, as a Percent of the Civilian Labor Force plus all Marginally Attached Workers).

Figure 1: Civilian Unemployment & Total Unemployment
B. Educational Attainment
- Unemployment Rate – Bachelor’s Degree and Higher, 25 years and over (FRED code: LNS14027662) from 1997 (January) to 2019 (January).
- A Multi-Series Graph and plot Unemployment Rate – High School Graduates, No College, 25 years and over (FRED code: LNU04027660) from 1997 (January) to 2019 (January).

Figure 2: Unemployment Rate: College Graduates & High School Graduates
C. Gender
- Unemployment Rate – Men (FRED code: LNS14000001) from 1977 (January) to 2019 (January).
- A Multi-Series Graph and plot Unemployment Rate – Women (FRED code: LNS14000002) from 1977 (January) to 2019 (January).

Figure 3: Unemployment Rate by Gender
D. Race
- Unemployment Rate – White (FRED code: LNS14000003) from 1977 (January) to 2019 (January).
- A Multi-Series Graph and plot Unemployment Rate – Black (FRED code: LNS14000006) from 1977 (January) to 2019 (January).
- A second Multi-Series Graph plotting Unemployment Rate – Hispanic (FRED code: LNS14000009) from 1977 (January) to 2019 (January).

Figure 4: Unemployment Rate by Race
Review the Narrated PowerPoint Tutorial for help with your narration.
SOLUTION
 ……………………..$10
ECON312N Week 5 Assignment Presentation – Unemployment Analysis