Question
Determine the Type II error if the null hypothesis, H0, is: a wooden ladder can withstand weights of 250 pounds and less.
Question
Which graph below corresponds to the following hypothesis test?
H0:μ≥5.9, Ha:μ<5.9
Question
Jamie, a bowler, claims that her bowling score is less than 168 points, on average. Several of her teammates do not believe her, so she decides to do a hypothesis test, at a 1% significance level, to persuade them. She bowls 17 games. The mean score of the sample games is 155 points. Jamie knows from experience that the standard deviation for her bowling score is 19 points.
- H0: μ≥168; Ha: μ<168
- α=0.01 (significance level)
What is the test statistic (z-score) of this one-mean hypothesis test, rounded to two decimal places?
Question
Which of the following results in a null hypothesis p≤0.61 and alternative hypothesis p>0.61?
Question
Which of the following results in a null hypothesis p≥0.44 and alternative hypothesis p<0.44?
Question
Determine the Type I error if the null hypothesis, H0, is: the percentage of homes in the city that are not up to the current electric codes is no more than 10%.
And, the alternative hypothesis, Ha, is: the percentage of homes in the city that are not up to the current electric codes is more than 10%.
Question
Which graph below corresponds to the following hypothesis test?
H0:p≤8.1, Ha:p>8.1
Question
Lexie, a bowler, claims that her bowling score is more than 140 points, on average. Several of her teammates do not believe her, so she decides to do a hypothesis test, at a 5% significance level, to persuade them. She bowls 18 games. The mean score of the sample games is 155 points. Lexie knows from experience that the standard deviation for her bowling score is 17 points.
- H0: μ≤140; Ha: μ>140
- α=0.05 (significance level)
What is the test statistic (z-score) of this one-mean hypothesis test, rounded to two decimal places?
Question
Which of the following results in a null hypothesis p≤0.69 and alternative hypothesis p>0.69?
Question
Which of the following results in a null hypothesis μ≤7 and alternative hypothesis μ>7?
Question
Suppose the null hypothesis, H0, is: a sporting goods store claims that at least 70% of its customers do not shop at any other sporting goods stores. What is the Type I error in this scenario?
Question
Determine the Type II error if the null hypothesis, H0, is: researchers claim that 65% of college students will graduate with debt.
Question
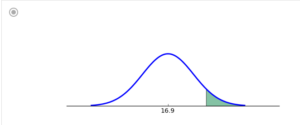
Which graph below corresponds to the following hypothesis test?
H0:μ≤16.9, Ha:μ>16.9
Question
Which of the hypothesis tests listed below is a left-tailed test? Select all correct answers.
Question
Suppose a pitcher claims that her pitch speed is not equal to 45 miles per hour, on average. Several of her teammates do not believe her, so the pitcher decides to do a hypothesis test, at a 1% significance level, to persuade them. She throws 21 pitches. The mean speed of the sample pitches is 46 miles per hour. The pitcher knows from experience that the standard deviation for her pitch speed is 6 miles per hour.
- H0: μ=45; Ha: μ≠45
- α=0.01 (significance level)
What is the test statistic (z-score) of this one-mean hypothesis test, rounded to two decimal places?
Question
Suppose a bowler claims that her bowling score is less than 116 points, on average. Several of her teammates do not believe her, so the bowler decides to do a hypothesis test, at a 5% significance level, to persuade them. She bowls 25 games. The mean score of the sample games is 103 points. The bowler knows from experience that the standard deviation for her bowling score is 19 points.
- H0: μ≥116; Ha: μ<116
- α=0.05 (significance level)
What is the test statistic (z-score) of this one-mean hypothesis test, rounded to two decimal places?
Solution
Question
Which graph below corresponds to the following hypothesis test?
H0:μ≤16.9, Ha:μ>16.9

Question
Determine the Type II error if the null hypothesis, H0, is: a wooden ladder can withstand weights of 250 pounds and less.
Answer: You think the ladder can withstand weight of 25…
Question
Which of the following results in a null hypothesis p≤0.61 and alternative hypothesis p>0.61?
Answer: A study says that at most 61% of students study less than 5 hours per week. …………….please follow the link below to purchase the solution at $10
